Here comes the last part of “IoT Garden” series where I’ll demonstrate how to quickly visualize data gathered from various sensors. Now for my project I wanted to visualize temperature, humidity and soil moisture collected from my garden. In last post we saw way to bring collected data upto AWS IoT over MQTT Topic called “garden/data”. In this post, I’ll walk you through how different AWS services will help us visualize this data!
Amazon CloudWatch Custom Metric
In order to visualize our parameters, simpledt way is to plot them all against time and see them side-by-side to analyze impact of one parameter on another e.g. How does temperature and moisture impact soil moisture. In order to do this, we need to plot and store out data received on “garden/data” MQTT topic in a time series manner.
Enter – Amazon CloudWatch Metrics – CloudWatch is an AWS service that allows you to do couple of things but here, we’ll focus on just one of these called “Custom Metrics”. A metric will be a measurement against some parameter like temperature. So basically we’ll have to create 3 custom metric – temperature, humidity and soil moisture and feed data to those metric over time as we receive data on “garden/data” MQTT topic.
Now If we see data arriving over MQTT as a stream, we can process data in stream and keep recording data samples against one of custom metric.
Amazon Lambda – Serverless Compute
Stream computing is precisely what AWS Lambda provides, with this service, you only need to work about how does a “function” work on one set of input to produce (optional) output. Since this type of computation is stateless and involves developer to just implement “function” to work on single event at a time, such services are also knows as “Function As a Service (FaaS)). AWS Lambda is one of the great providers of FaaS.
In our case, input is aggregated event that we receive over MQTT, this single event has data about temperature, humidity and soil moisture. Our “function” will then read this event and record 3 samples against 3 custom CloudWatch metrics. You can create lambda by following guide – http://docs.aws.amazon.com/lambda/latest/dg/building-lambda-apps.html
Together – AWS Lambda and Cloud watch will record all incoming samples against time. I again chose python as my language of choice although AWS Lambda offers various other language to choose from. My code in python looks like this:
CloudWatch – Visualization
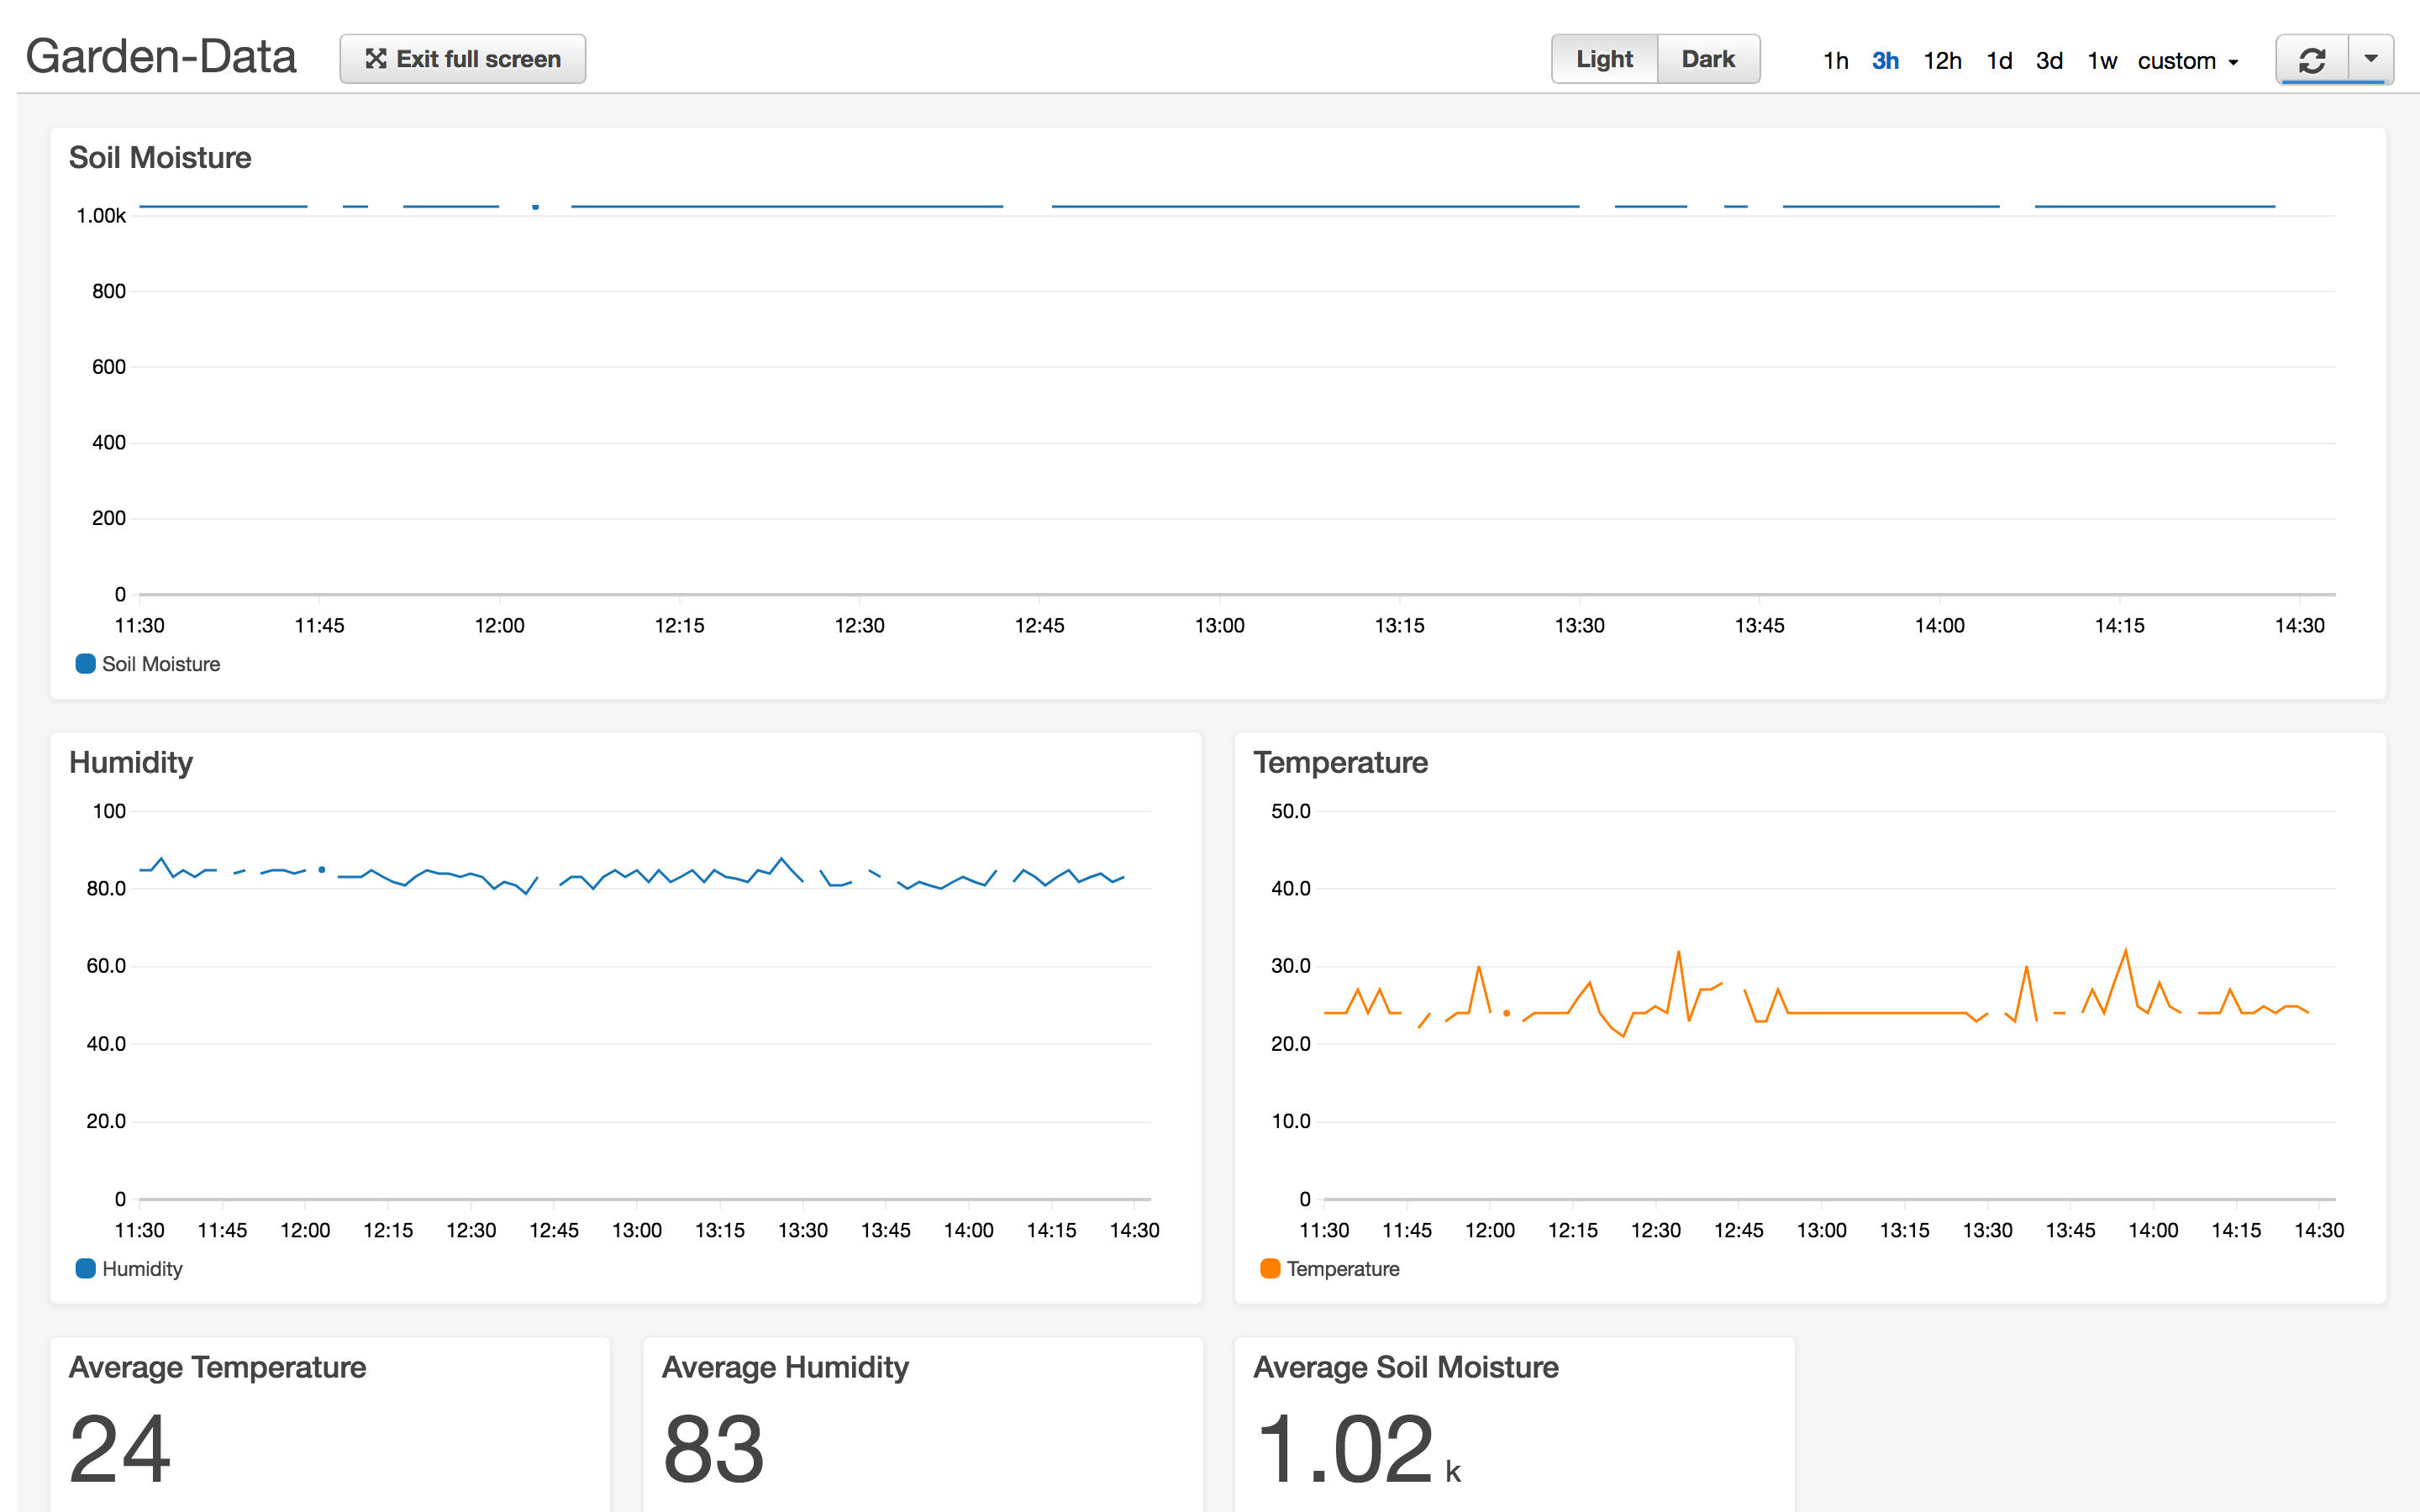
Now for final part, we need to see graphs for all 3 custom metrics – this can be done by using yet another service of AWS Cloudwatch – Dashboards. I created a new Dashboard, used 3 custom metrics and plotted a time series line graph for 3. My CloudWatch dashboard now looks like this:
As seen here, we were able to read data from sensors, forward it to Cloud IoT service, process it, store it as time-series data and finally visualize the same. Now MQTT being publish subscribe also adds capabilities such as callbacks so say if these parameters hit certain level or if our machine learning model concludes that we need to start watering the garden, we can do all that with sam setup. But for now, I’ll conclude this series and hope to write more about followup parts of series about using this data for machine learning soon, till then c’ya 😉